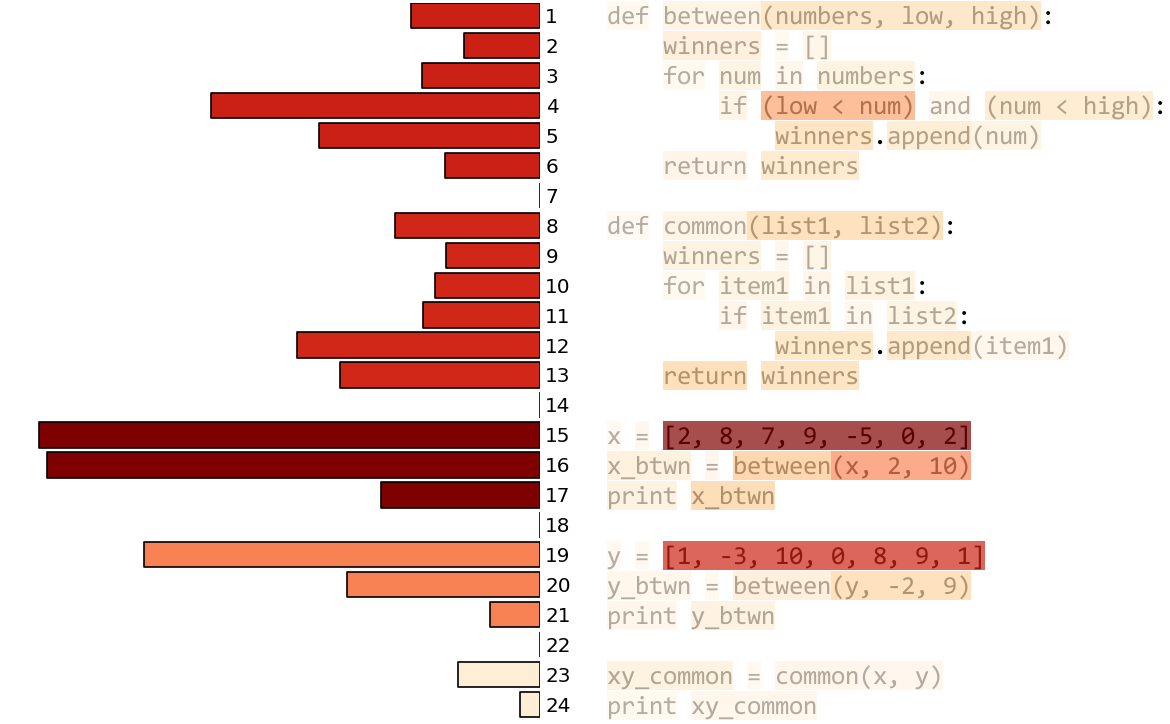
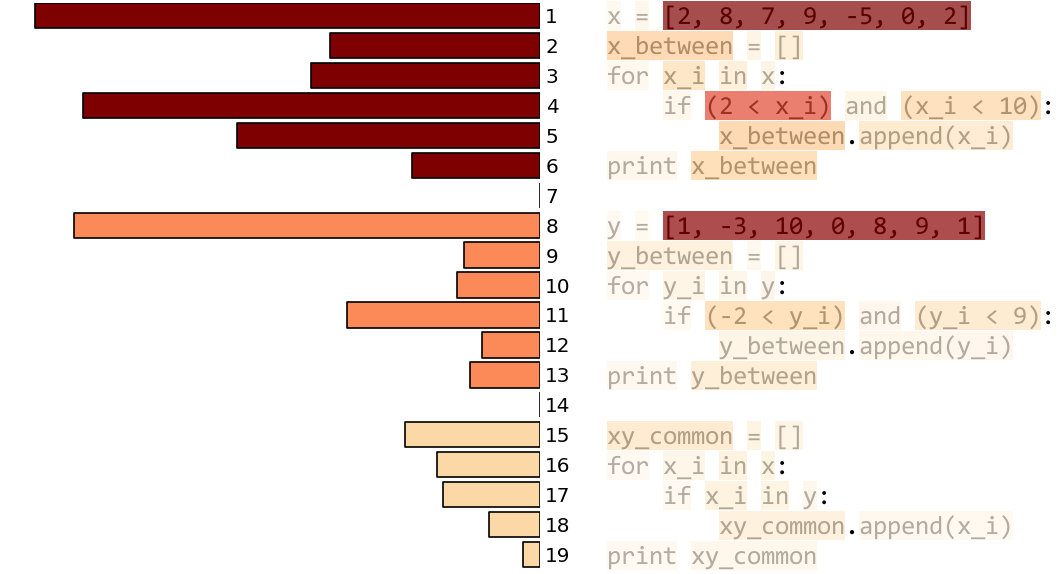
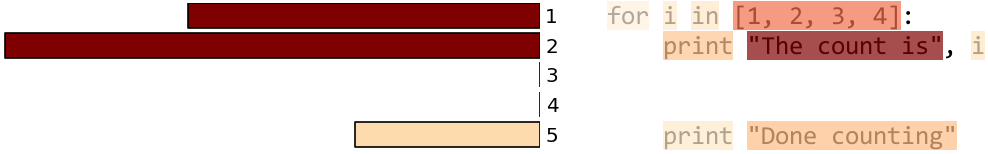
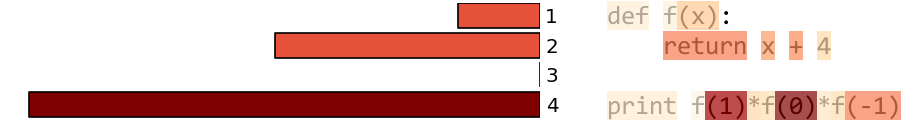
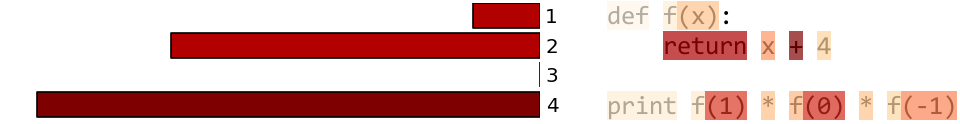
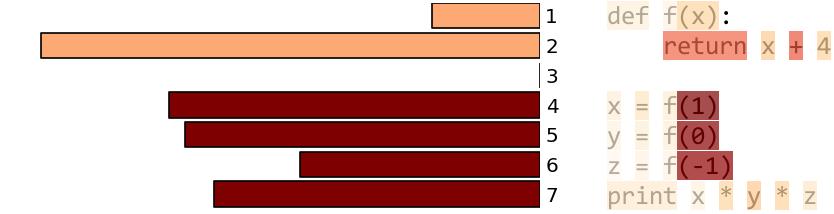
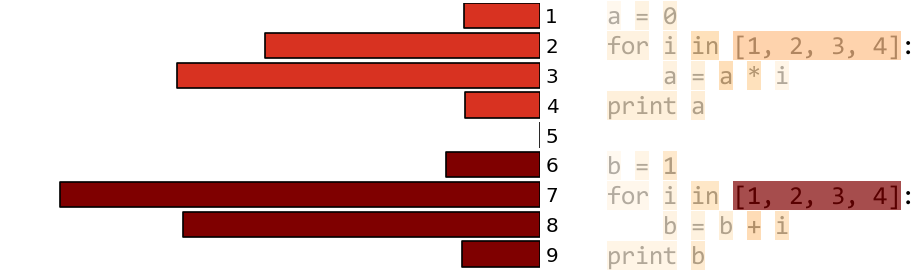
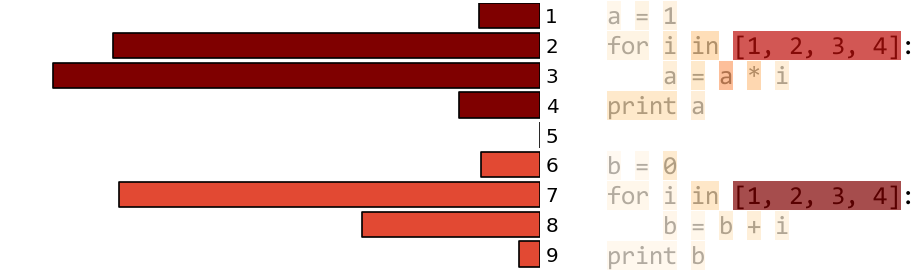
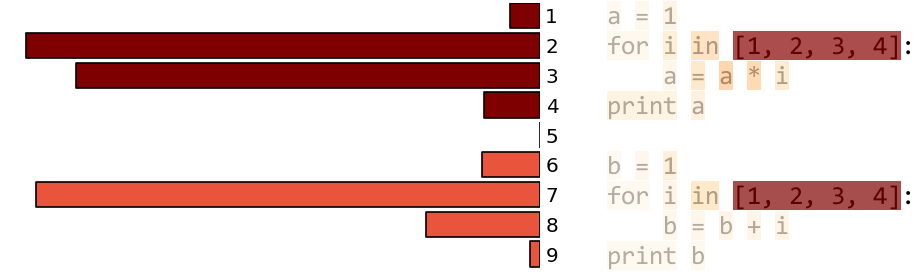
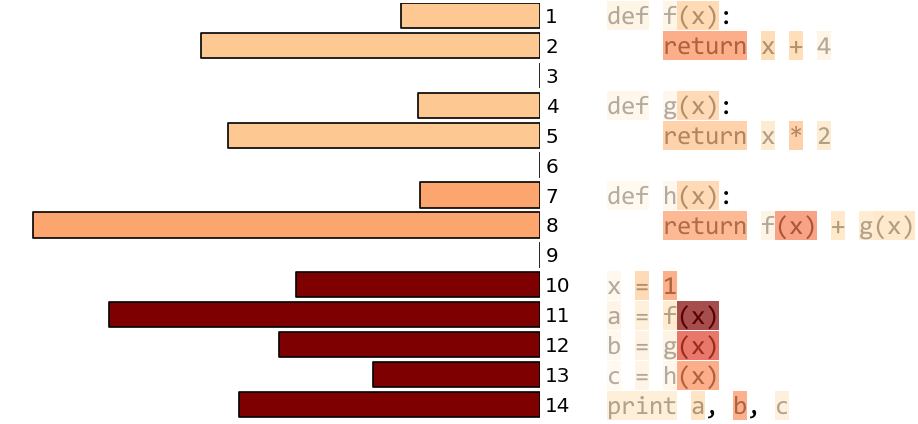
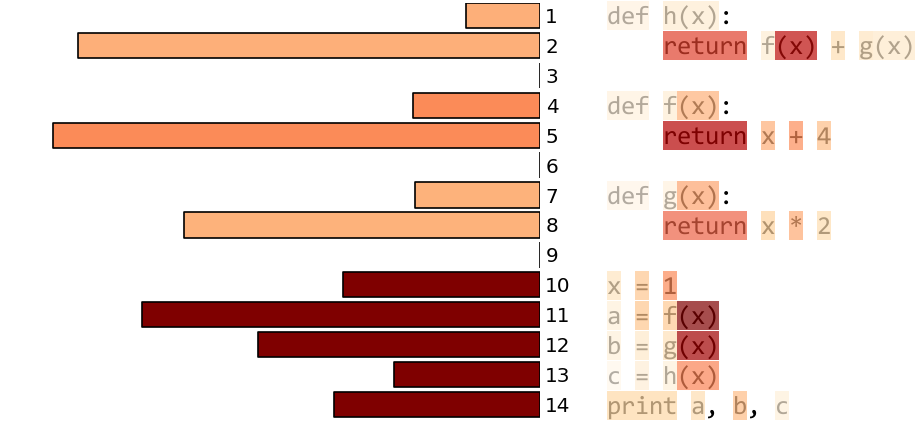
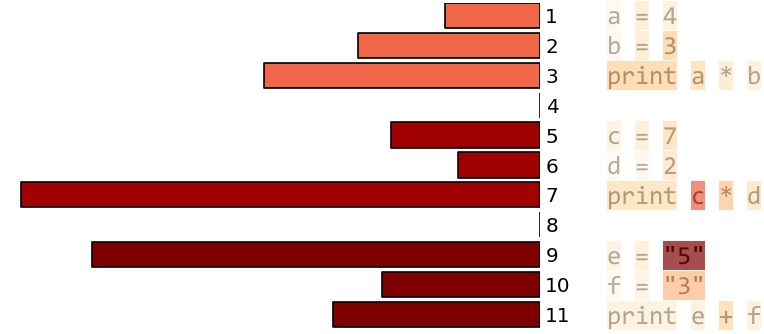
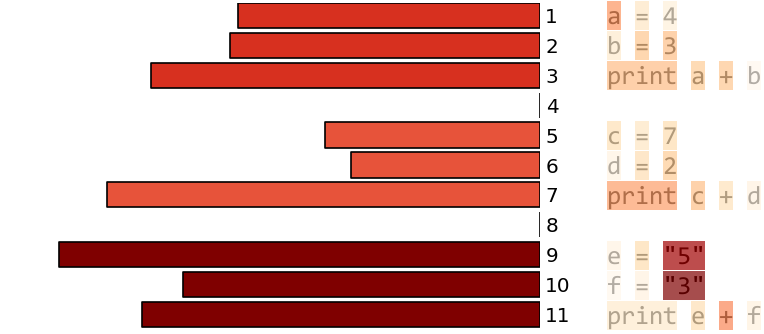
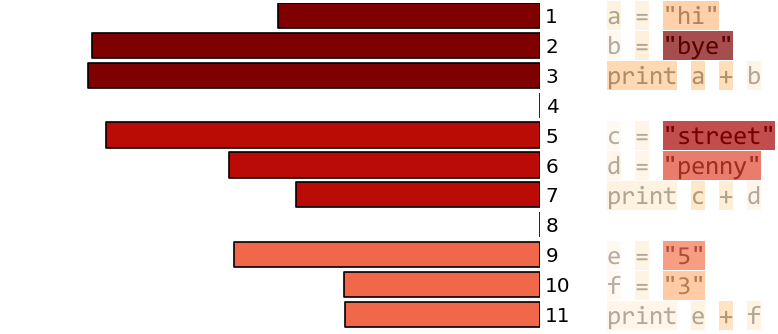
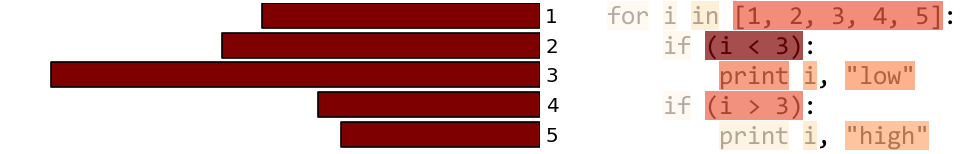
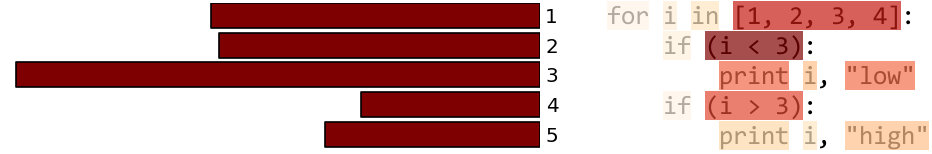
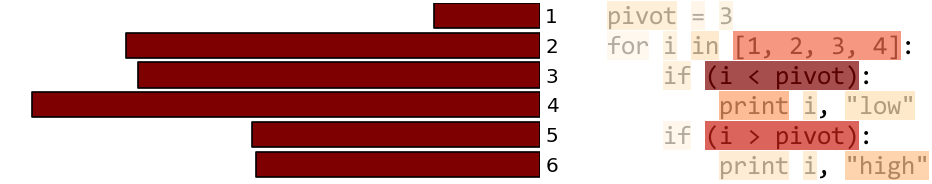
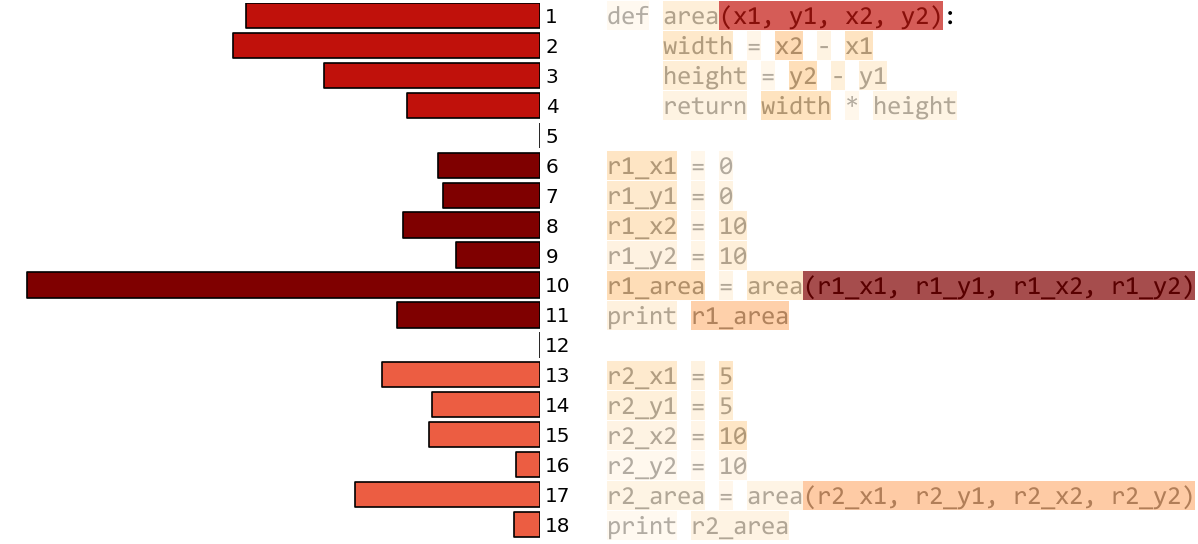
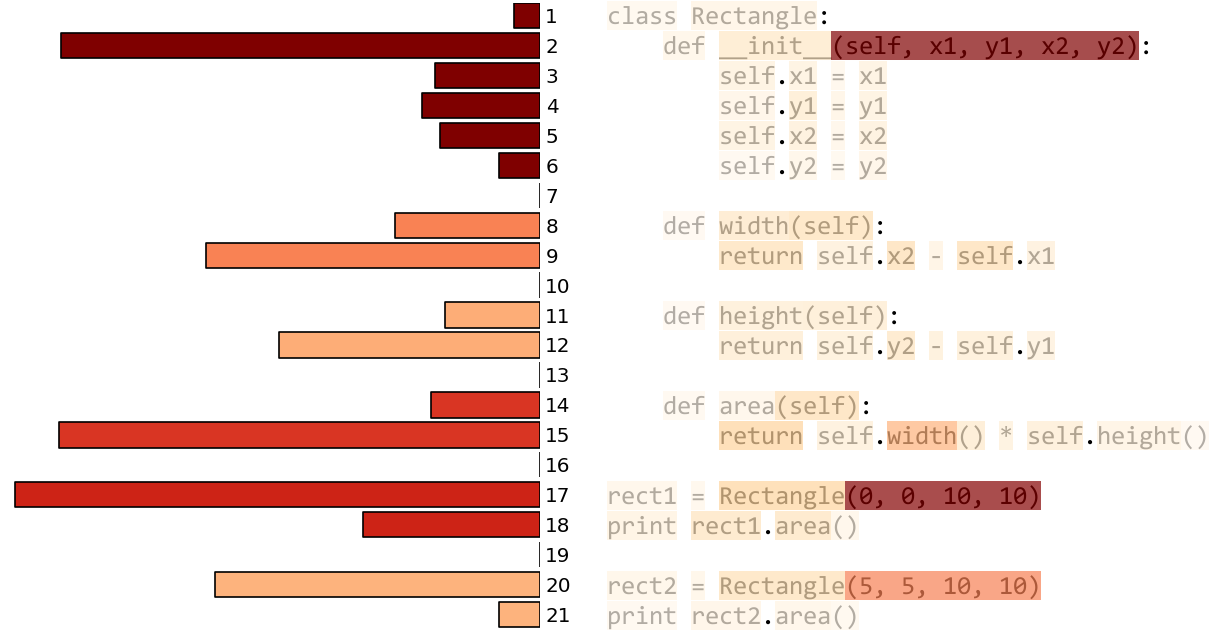
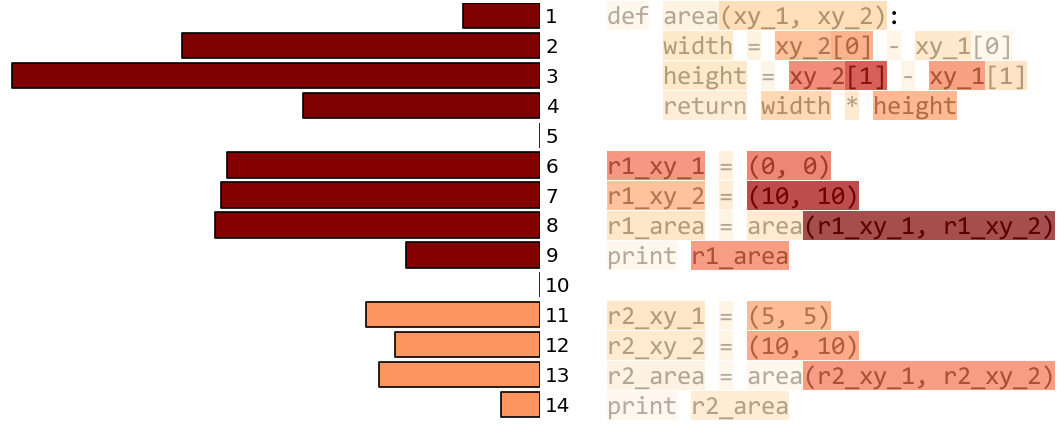
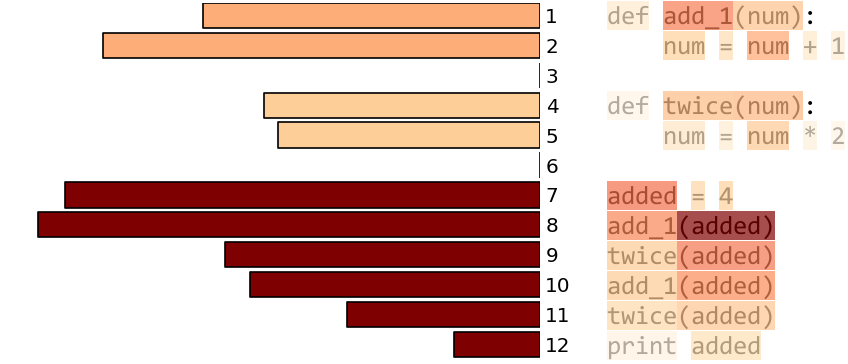
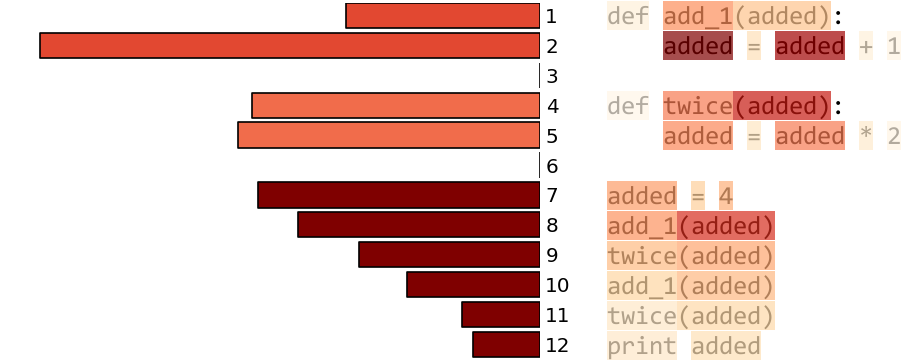
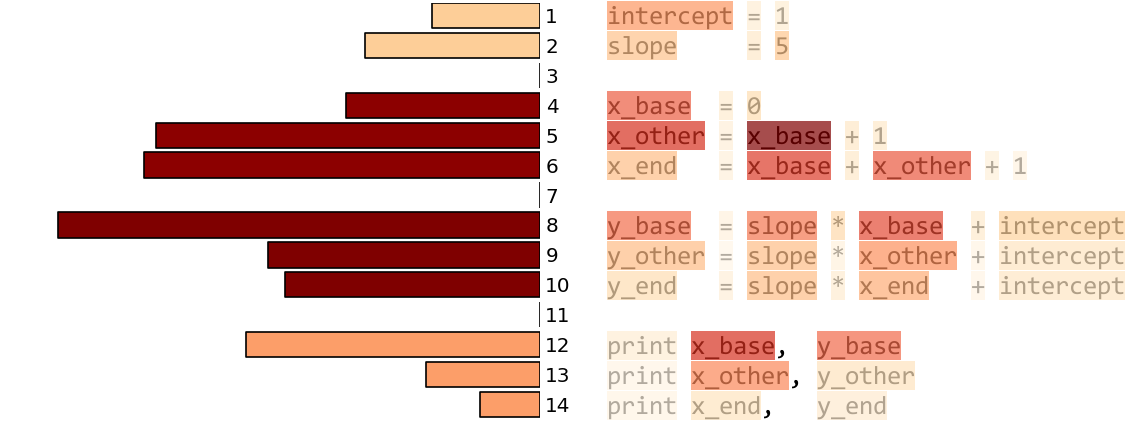
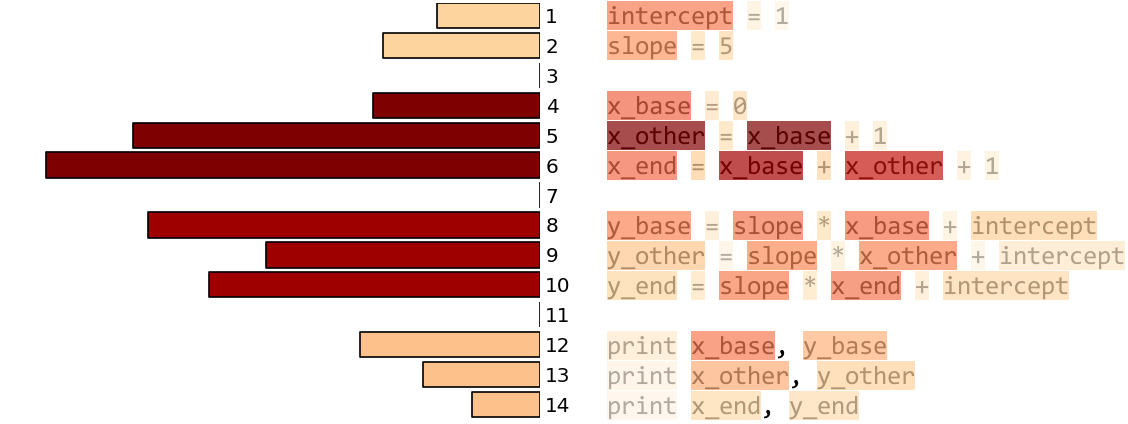
Three kinds of plots are shown below. The first contains information about total fixation duration on code elements, lines and whitespace-separated blocks in each program. The color of each element/line/block represents the relative amount of time all participants spent on it, with the minimum color being no time and the maximum color being the highest duration for that program.
The second kind of plot is created in two stages. First, the sequence of fixated areas of interest (lines and the output box where participants typed their response) was codified into a scanpath -- e.g., [1, 2, 3, out] means that line 1 was fixated followed by lines 2 and 3, and then finally the output box. In the second stage, each scanpath was used to construct a transition matrix from one AOI to another. In the plots below, matrix cells with a transition probability less than 0.2 are not annotated (the cell's color, however, still reflects the cell's value).
![]()
For the final plot kind, the transition matrix was interpreted as a graph adjacency matrix, with the transition probabilities as edge weights. A spring force layout of each graph is plotted, so that each AOI is close to its likely successors in a scanpath. The betweeness centrality of each node informs its color; the minimum and maximum values are relative to the individual graph.
Table of Contents
between
functions
![]()
![]()
inline
![]()
![]()
counting
nospace

![]()
![]()
twospaces
![]()
![]()
funcall
nospace
![]()
![]()
space
![]()
![]()
vars
![]()
![]()
initvar
bothbad
![]()
![]()
good
![]()
![]()
onebad
![]()
![]()
order
inorder
![]()
![]()
shuffled
![]()
![]()
overload
multmixed
![]()
![]()
plusmixed
![]()
![]()
strings
![]()
![]()
partition
balanced
![]()
![]()
unbalanced
![]()
![]()
unbalanced_pivot
![]()
![]()
rectangle
basic
![]()
![]()
class
![]()
![]()
tuples
![]()
![]()
scope
diffname
![]()
![]()
samename
![]()
![]()
whitespace
linedup
![]()
![]()
zigzag
![]()
![]()